ARTEMIS
Tutorial
Here we look at how ARTEMIS can be applied in practice. To do this, let’s analyze a small biomolecule consisting of 58 amino acid residues (968 atoms). All used files are located in the ./example/ directory. First, go to the directory and create a folder for the output files:
cd example

mkdir output
MD trajectory
The study begins with molecular dynamics calculations. Here we will use exemplar 0.2 µs all-atom MD trajectory obtained for the dimer of the mutant transmembrane domains of PDGFRA (details: DOI)
PARENT calculation
PARENT calculation was carried out using the GPU version of the program (GitHub). For the calculation, we used the MD trajectory with a length of 200 ns, calculated as indicated above, which was recorded for two different timesteps of 1 and 2 picoseconds (2e5 and 1e5 number of frames, respectively), respectively.
MI Matrix Calculation
We will immediately calculate the matrix without noise. To do this, run:
artemis map v536e_1ps.par v536e_2ps.par -n1 200000 -n2 100000 --denoise -o output/map.json
or
artemis map v536e_1ps.par v536e_2ps.par -n1 2e5 -n2 1e5 --denoise -o output/map.json
By executing the code, you will receive a mutual information matrix in an internal ARTEMIS format. To draw the matrix run:
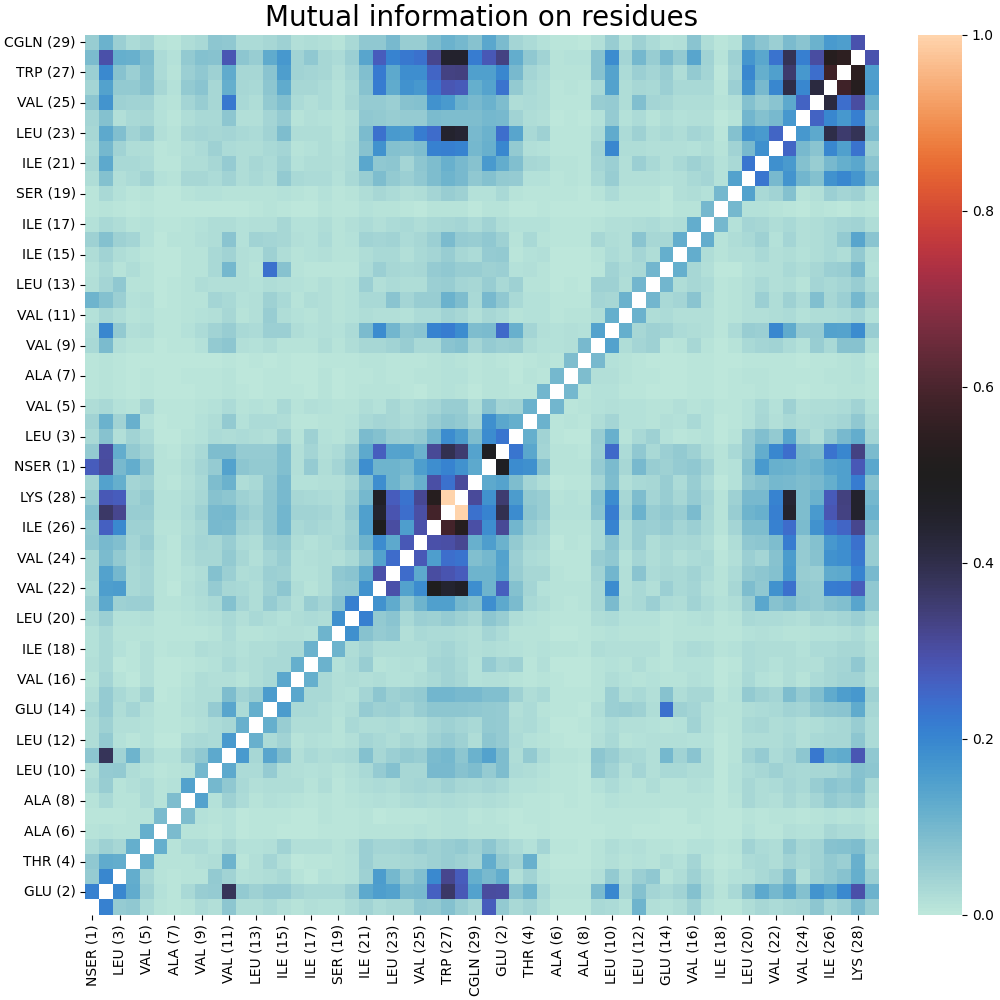
artemis map output/map.json --draw -norm -o output/map.pdf
As a result, we obtain a normalized matrix MI without diagonal elements:
Clustering
Let’s create a separate directory for clustering files:
mkdir output/cluster/
Preliminary analysis
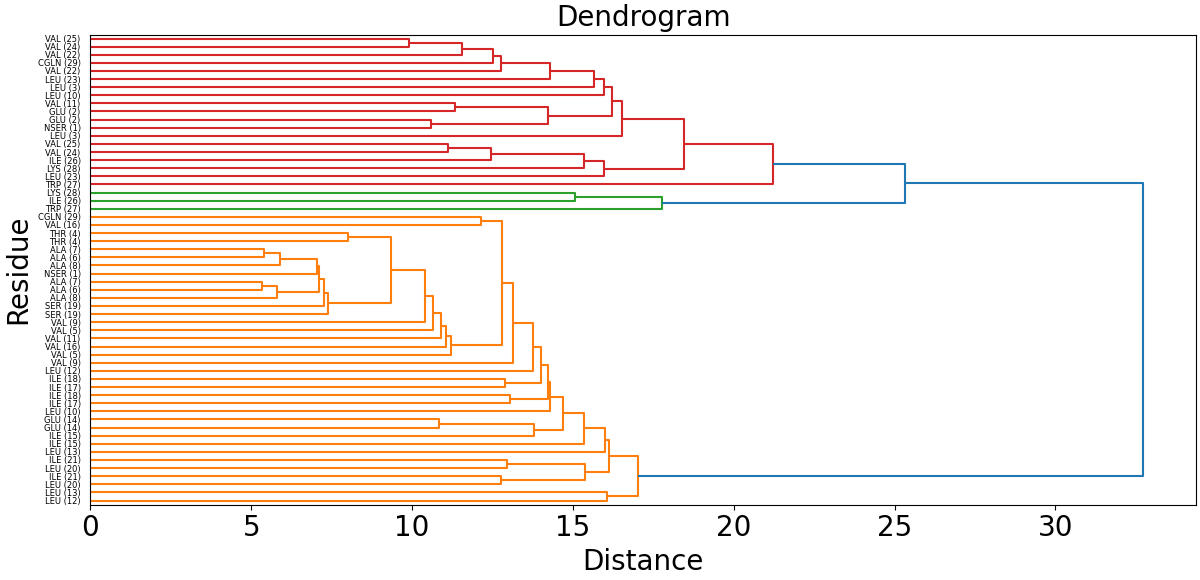
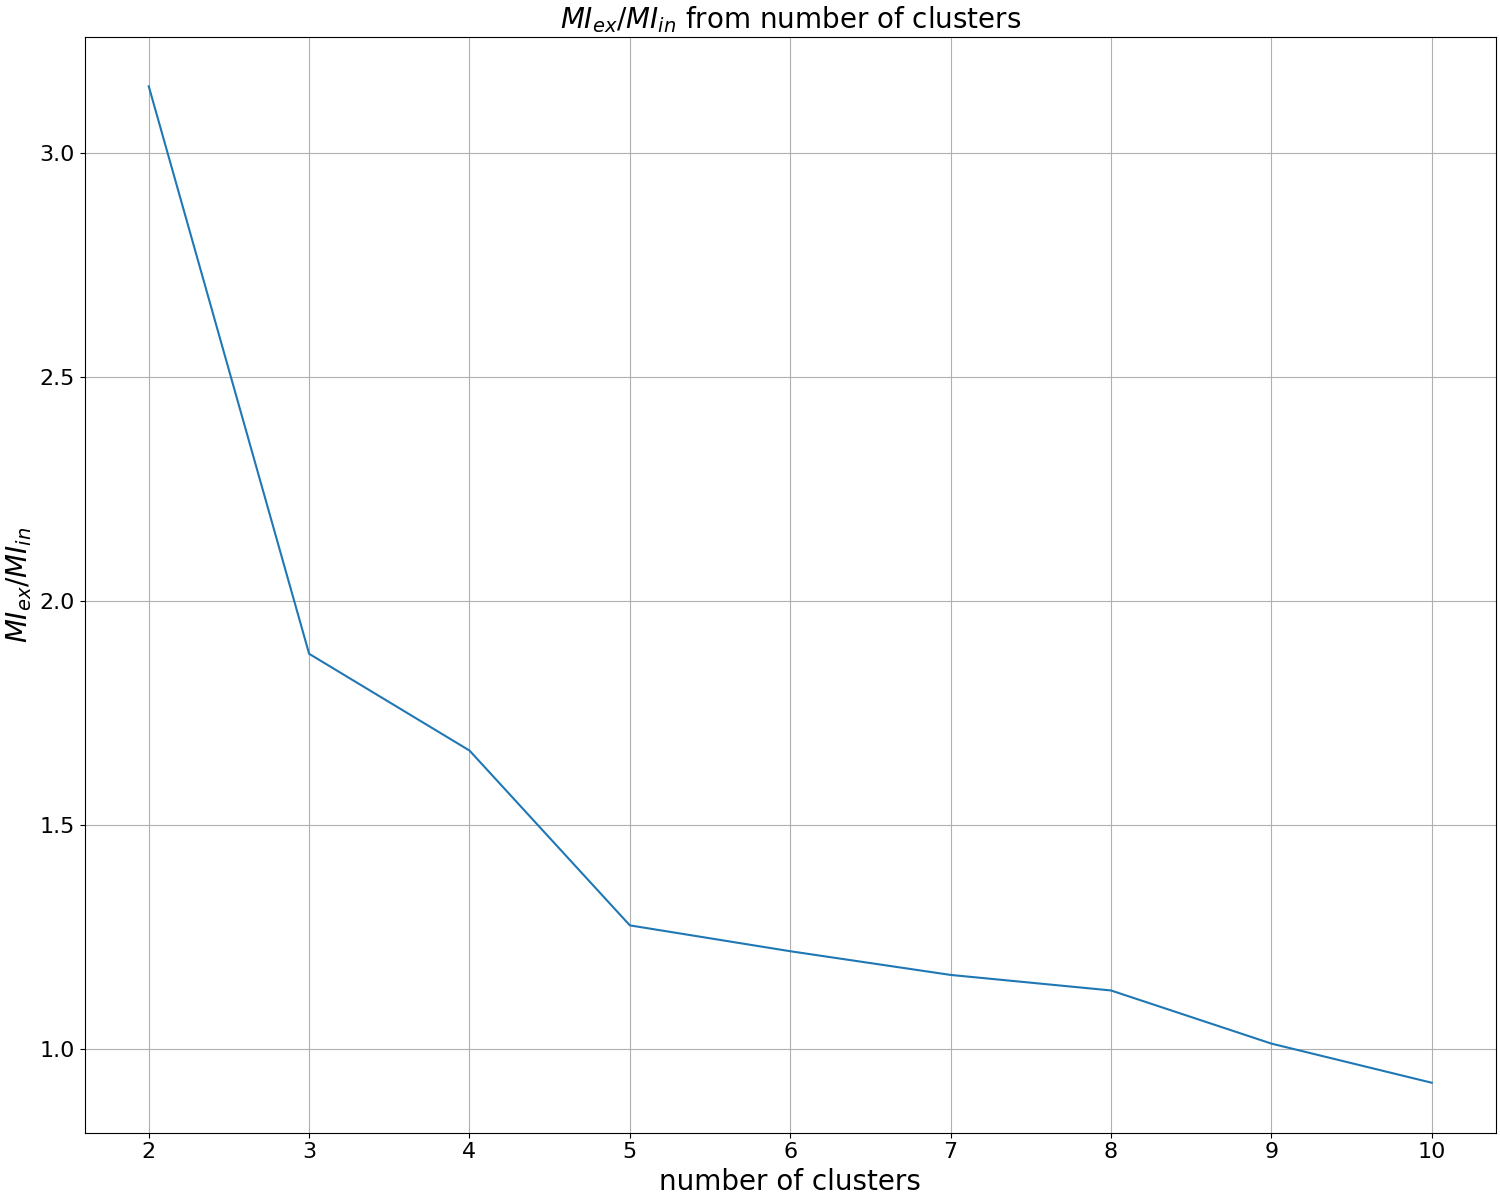
Before carrying out clustering, we will build a dendrogram and metrics for determining the optimal number of clusters. To do this, run:
artemis cluster --study output/map.json -o output/cluster/study.pdf
Having examined the dendrogram and metrics, we determine the number of clusters that is interesting to us. In the tutorial we will explore 4 clusters.
To take into account only the submatrix of protein interaction with a custom group, which is specified in the v536e_groups.json file with the reference_group key:
artemis cluster --study v536e_groups.json output/map.json -o output/cluster/study.pdf
Spectral clustering
To cluster the mutual information matrix using spectral clustering, run:
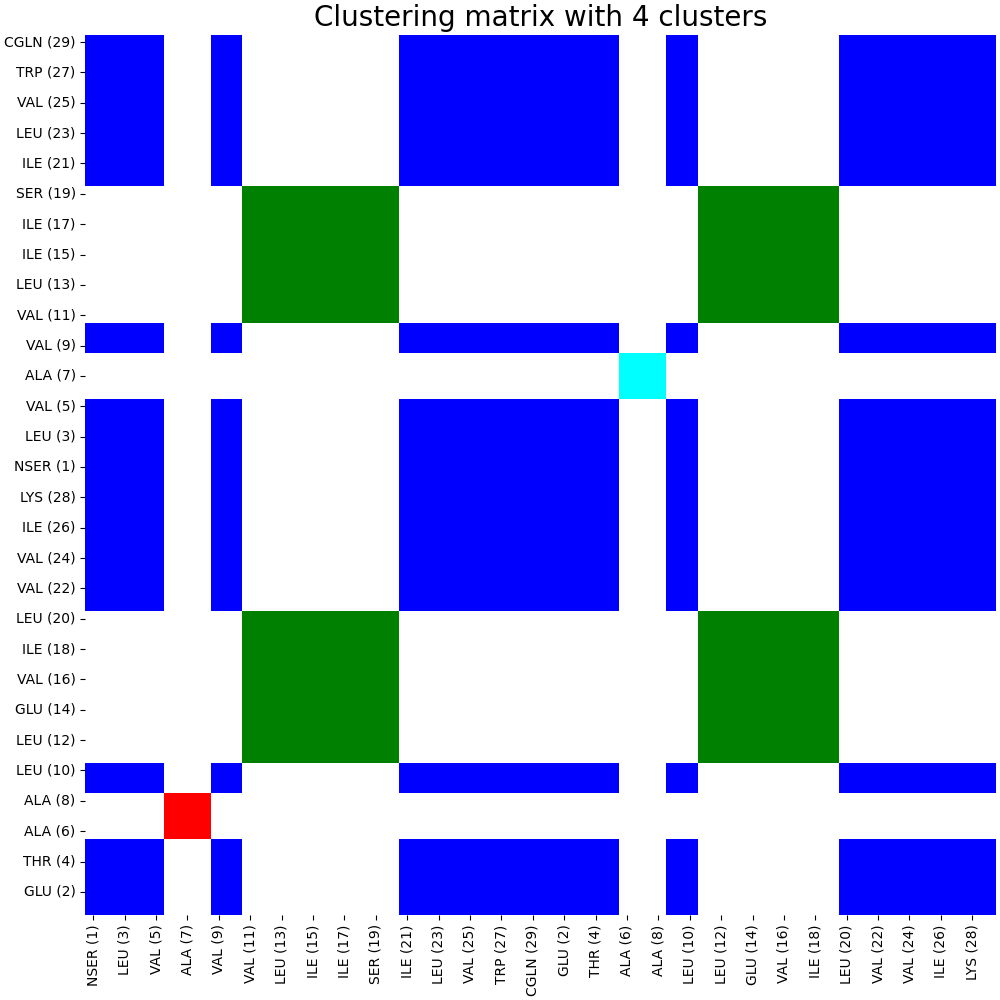
artemis cluster --cluster -spectral -nclust 4 output/map.json -o output/cluster/spectral.pdf
The code running above will create an internal clustering format for ARTEMIS and draw the clustering matrix in pdf format:
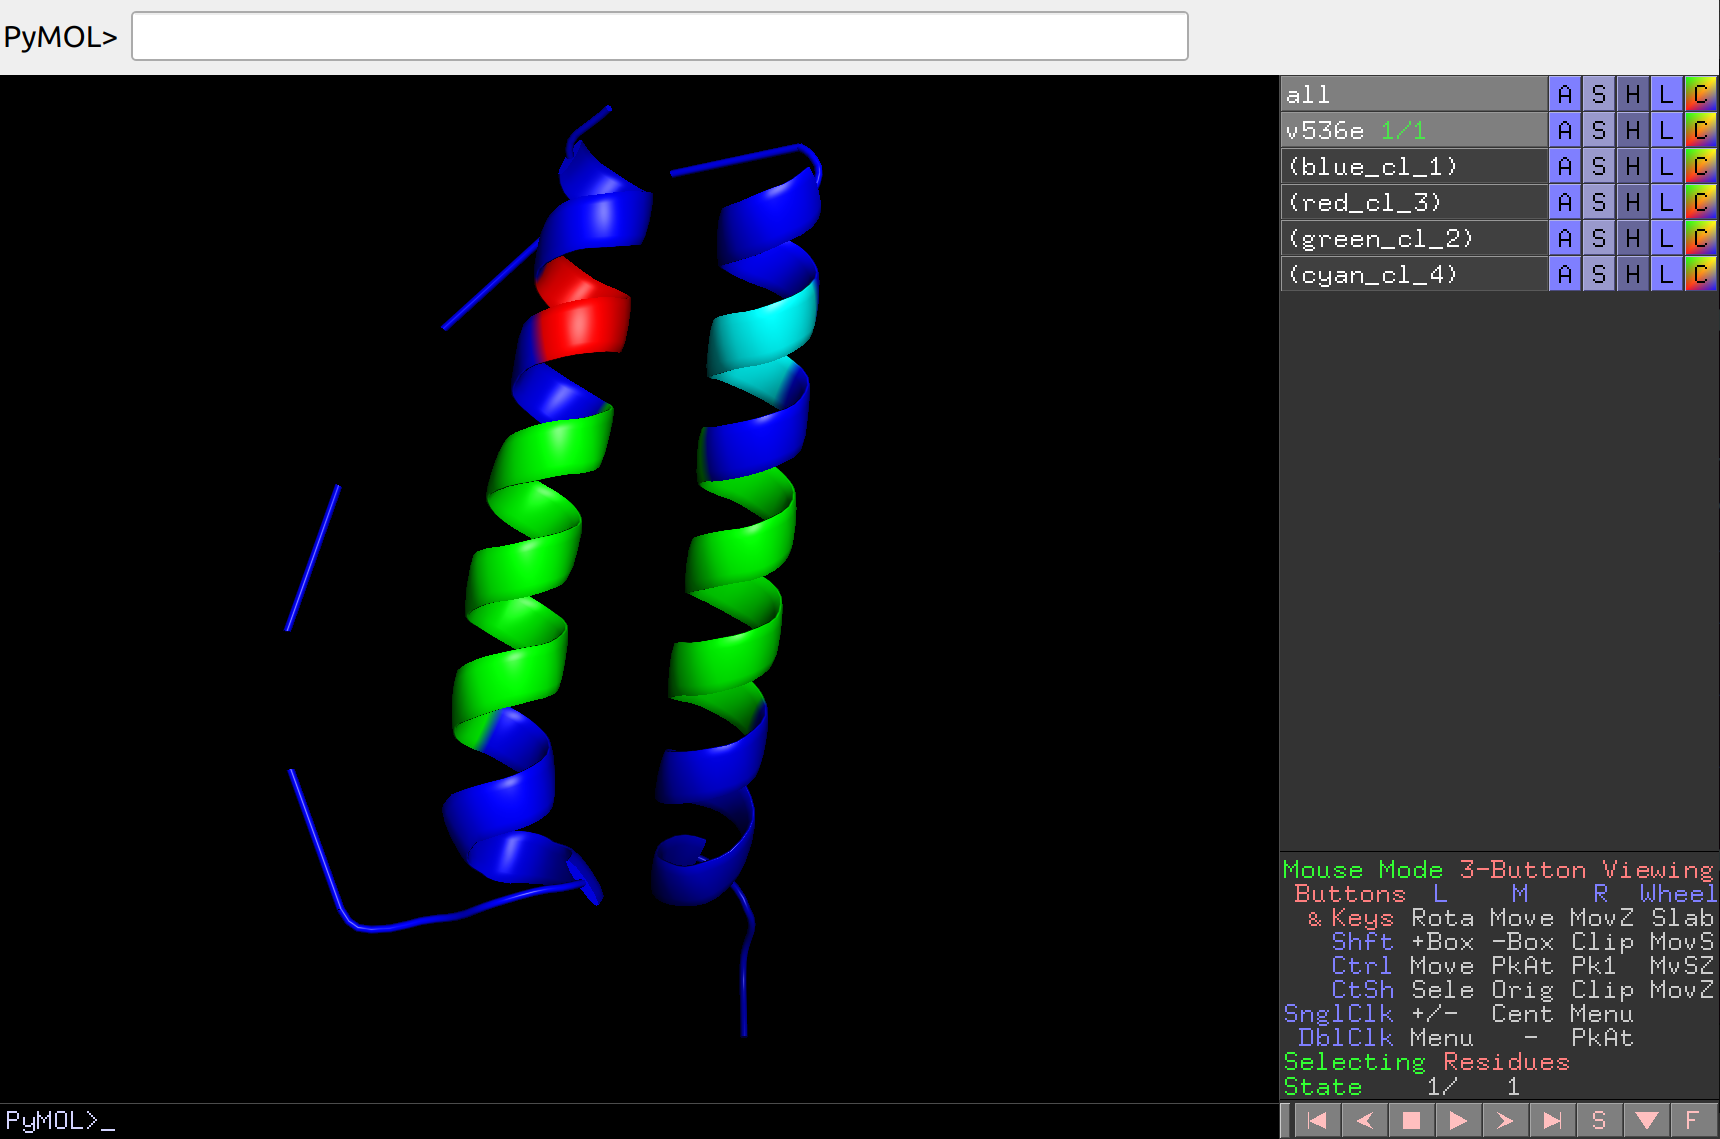
Let’s display clustering on the structure:
artemis cluster --draw output/cluster/spectral.json -strc v536e.pdb -o output/cluster/spectral.pse
Which can then be opened in PyMol and analyzed in more detail:
Agglomerative analysis
If you carry out agglomerative clustering using the full MI matrix, then the launch is similar to the spectral launch, only without using the -spectral flag. Let’s carry out agglomerative clustering using the submatrix of protein interaction with the user group, which is specified in the v536e_groups.json file with the reference_group key. To do this, let’s run:
artemis cluster --cluster v536e_groups.json output/map.json -nclust 7 -o output/cluster/agglomerative_submatrix.pdf
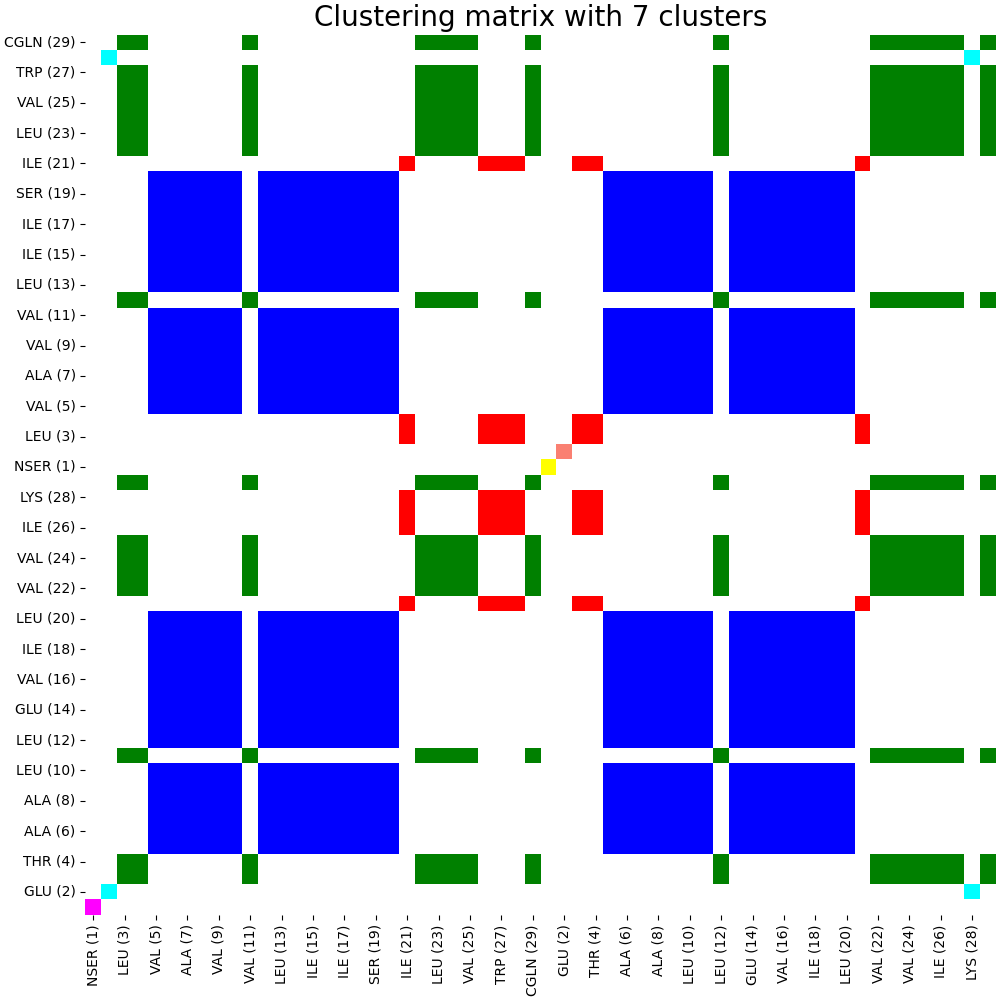
The code running above will create an internal clustering format for ARTEMIS and draw the clustering matrix in pdf format:
Clusters analysis
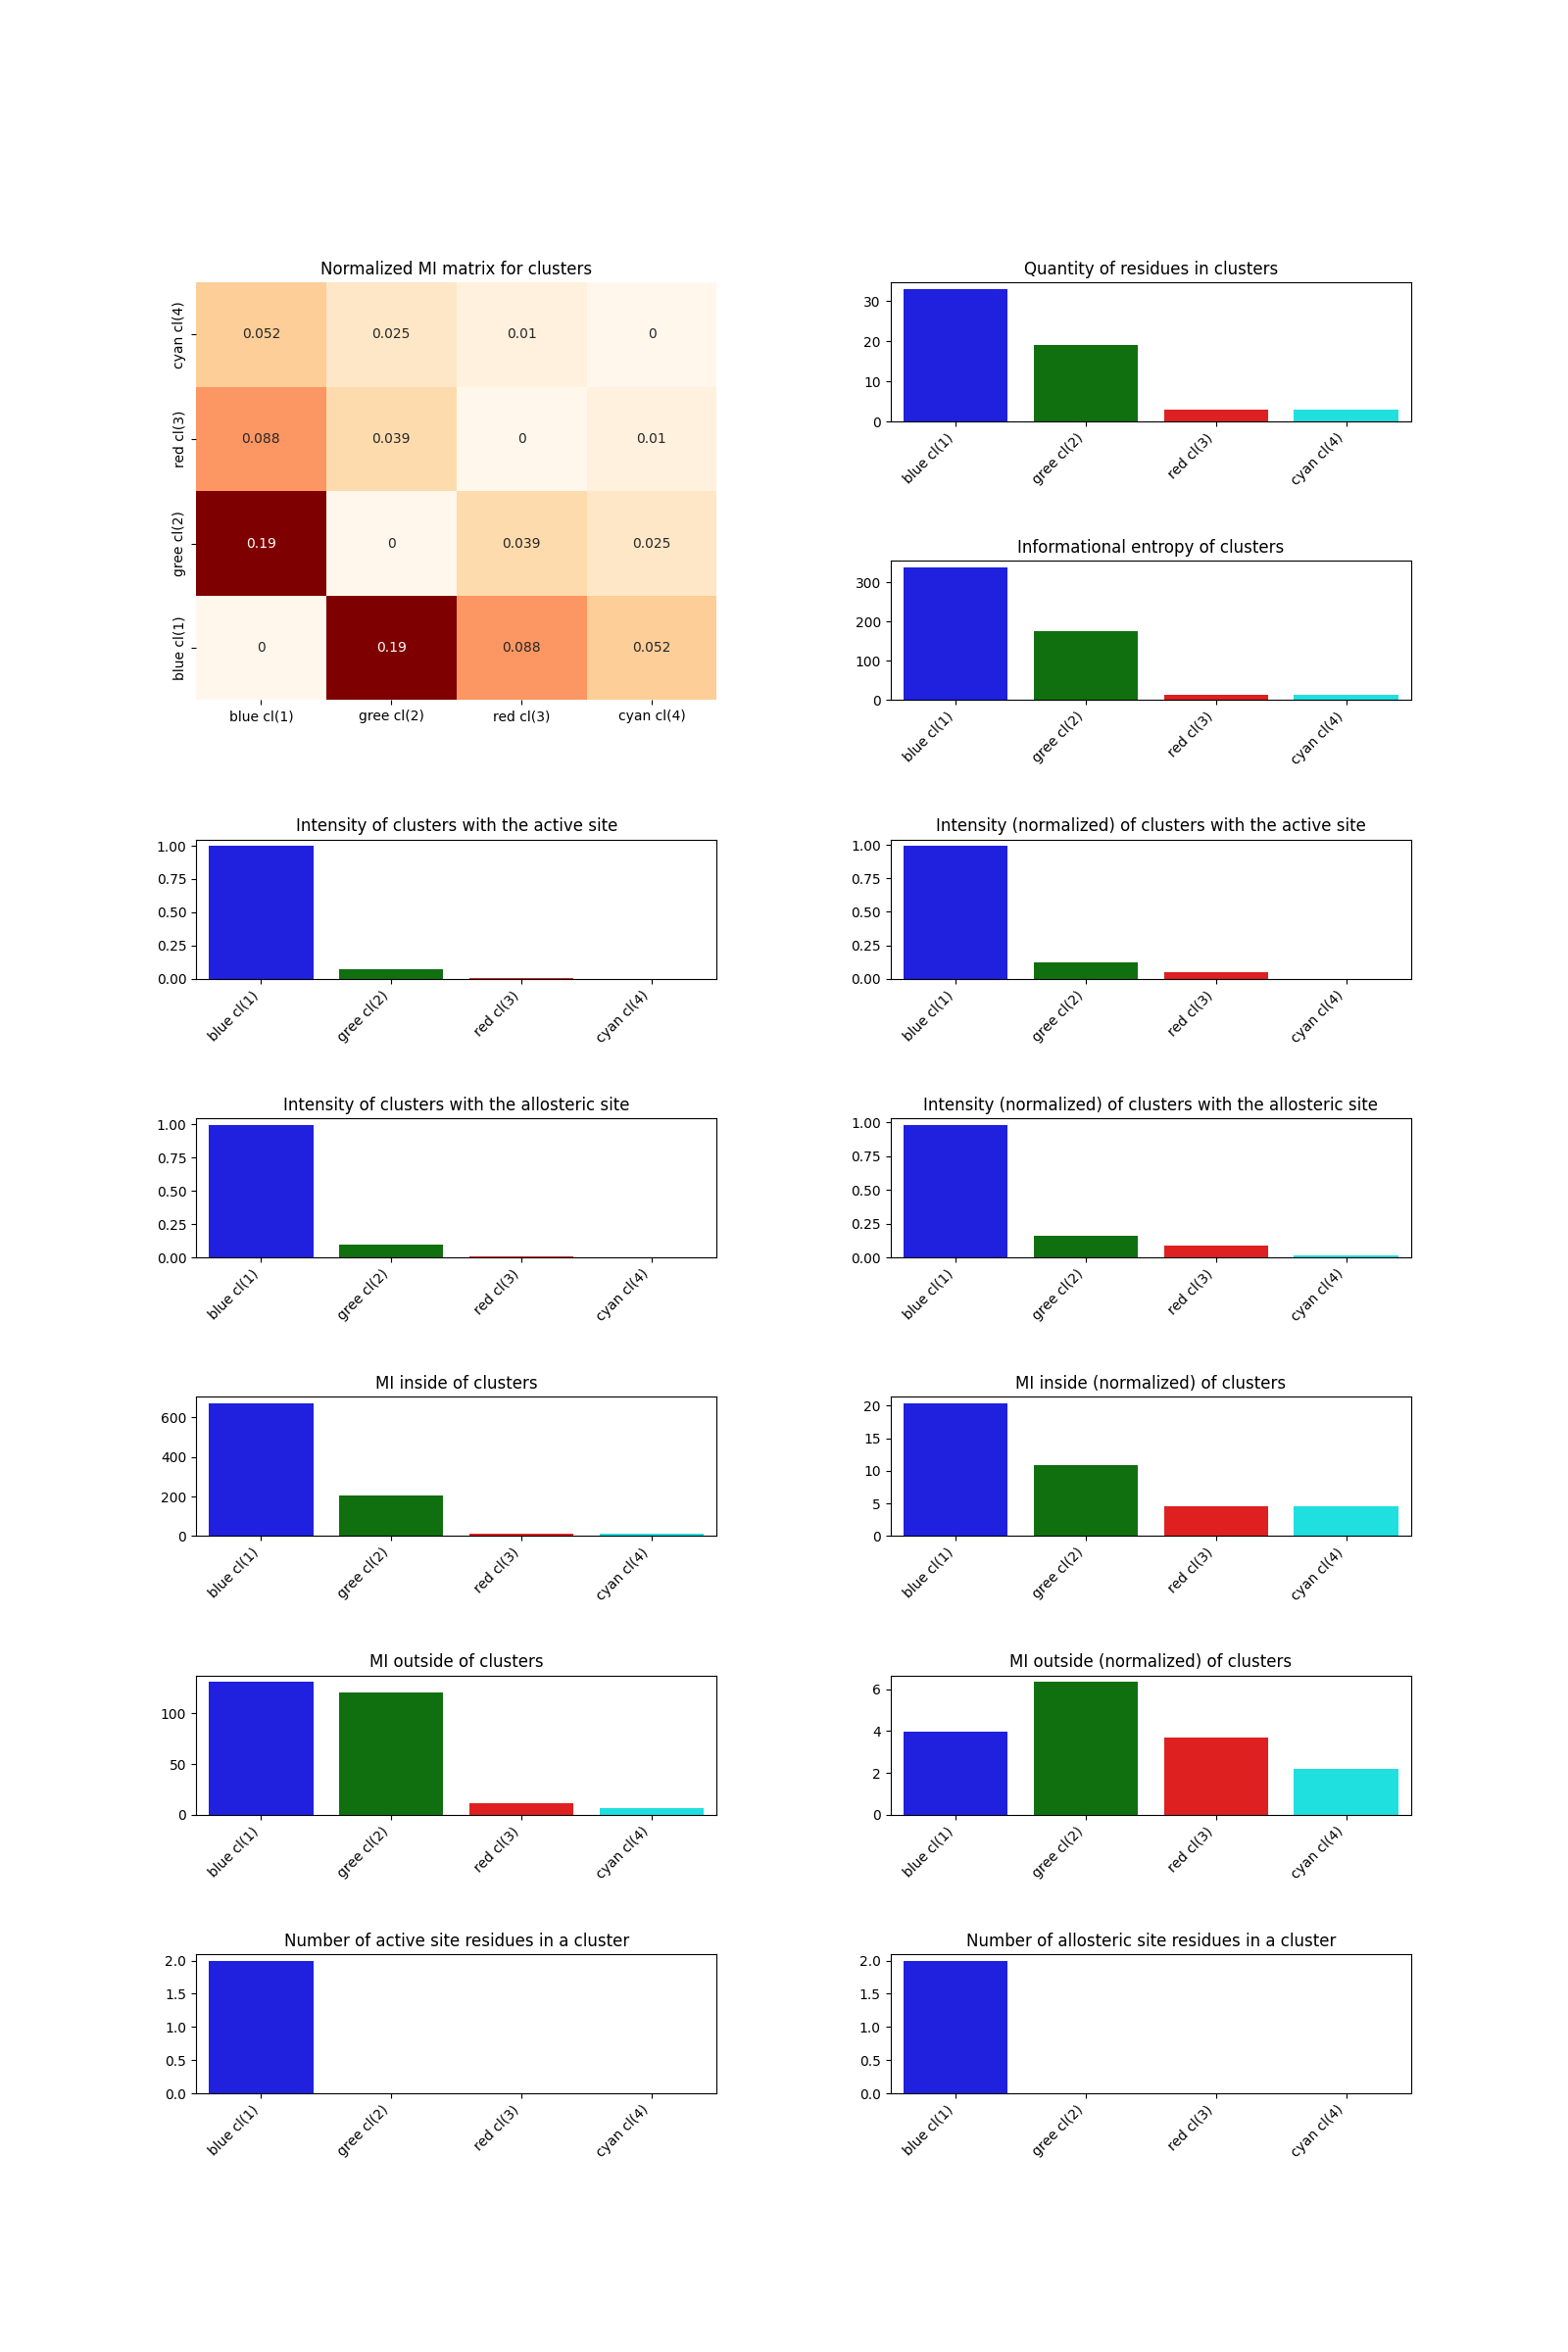
To analyze clustering taking into account the active and allosteric sites specified in the group file v536e_groups.json, run:
artemis cluster --analysis v536e_groups.json output/cluster/spectral.json -o output/cluster/spectral_analysis.pdf
As a result, the following file will be generated:
Internal communication (allostery search)
“Warning: in the current version the module that implements this is called “allostery”, but in the future it will be renamed.”
Let’s create a separate directory for communication files:
mkdir output/communication/
Let’s calculate the intensity of communication with the user site (which is specified in the v536e_groups.json file with the active_site key), display it on the structure and carry out analysis with the second user group (which is specified in the v536e_groups.json file with the allosteric_site key).
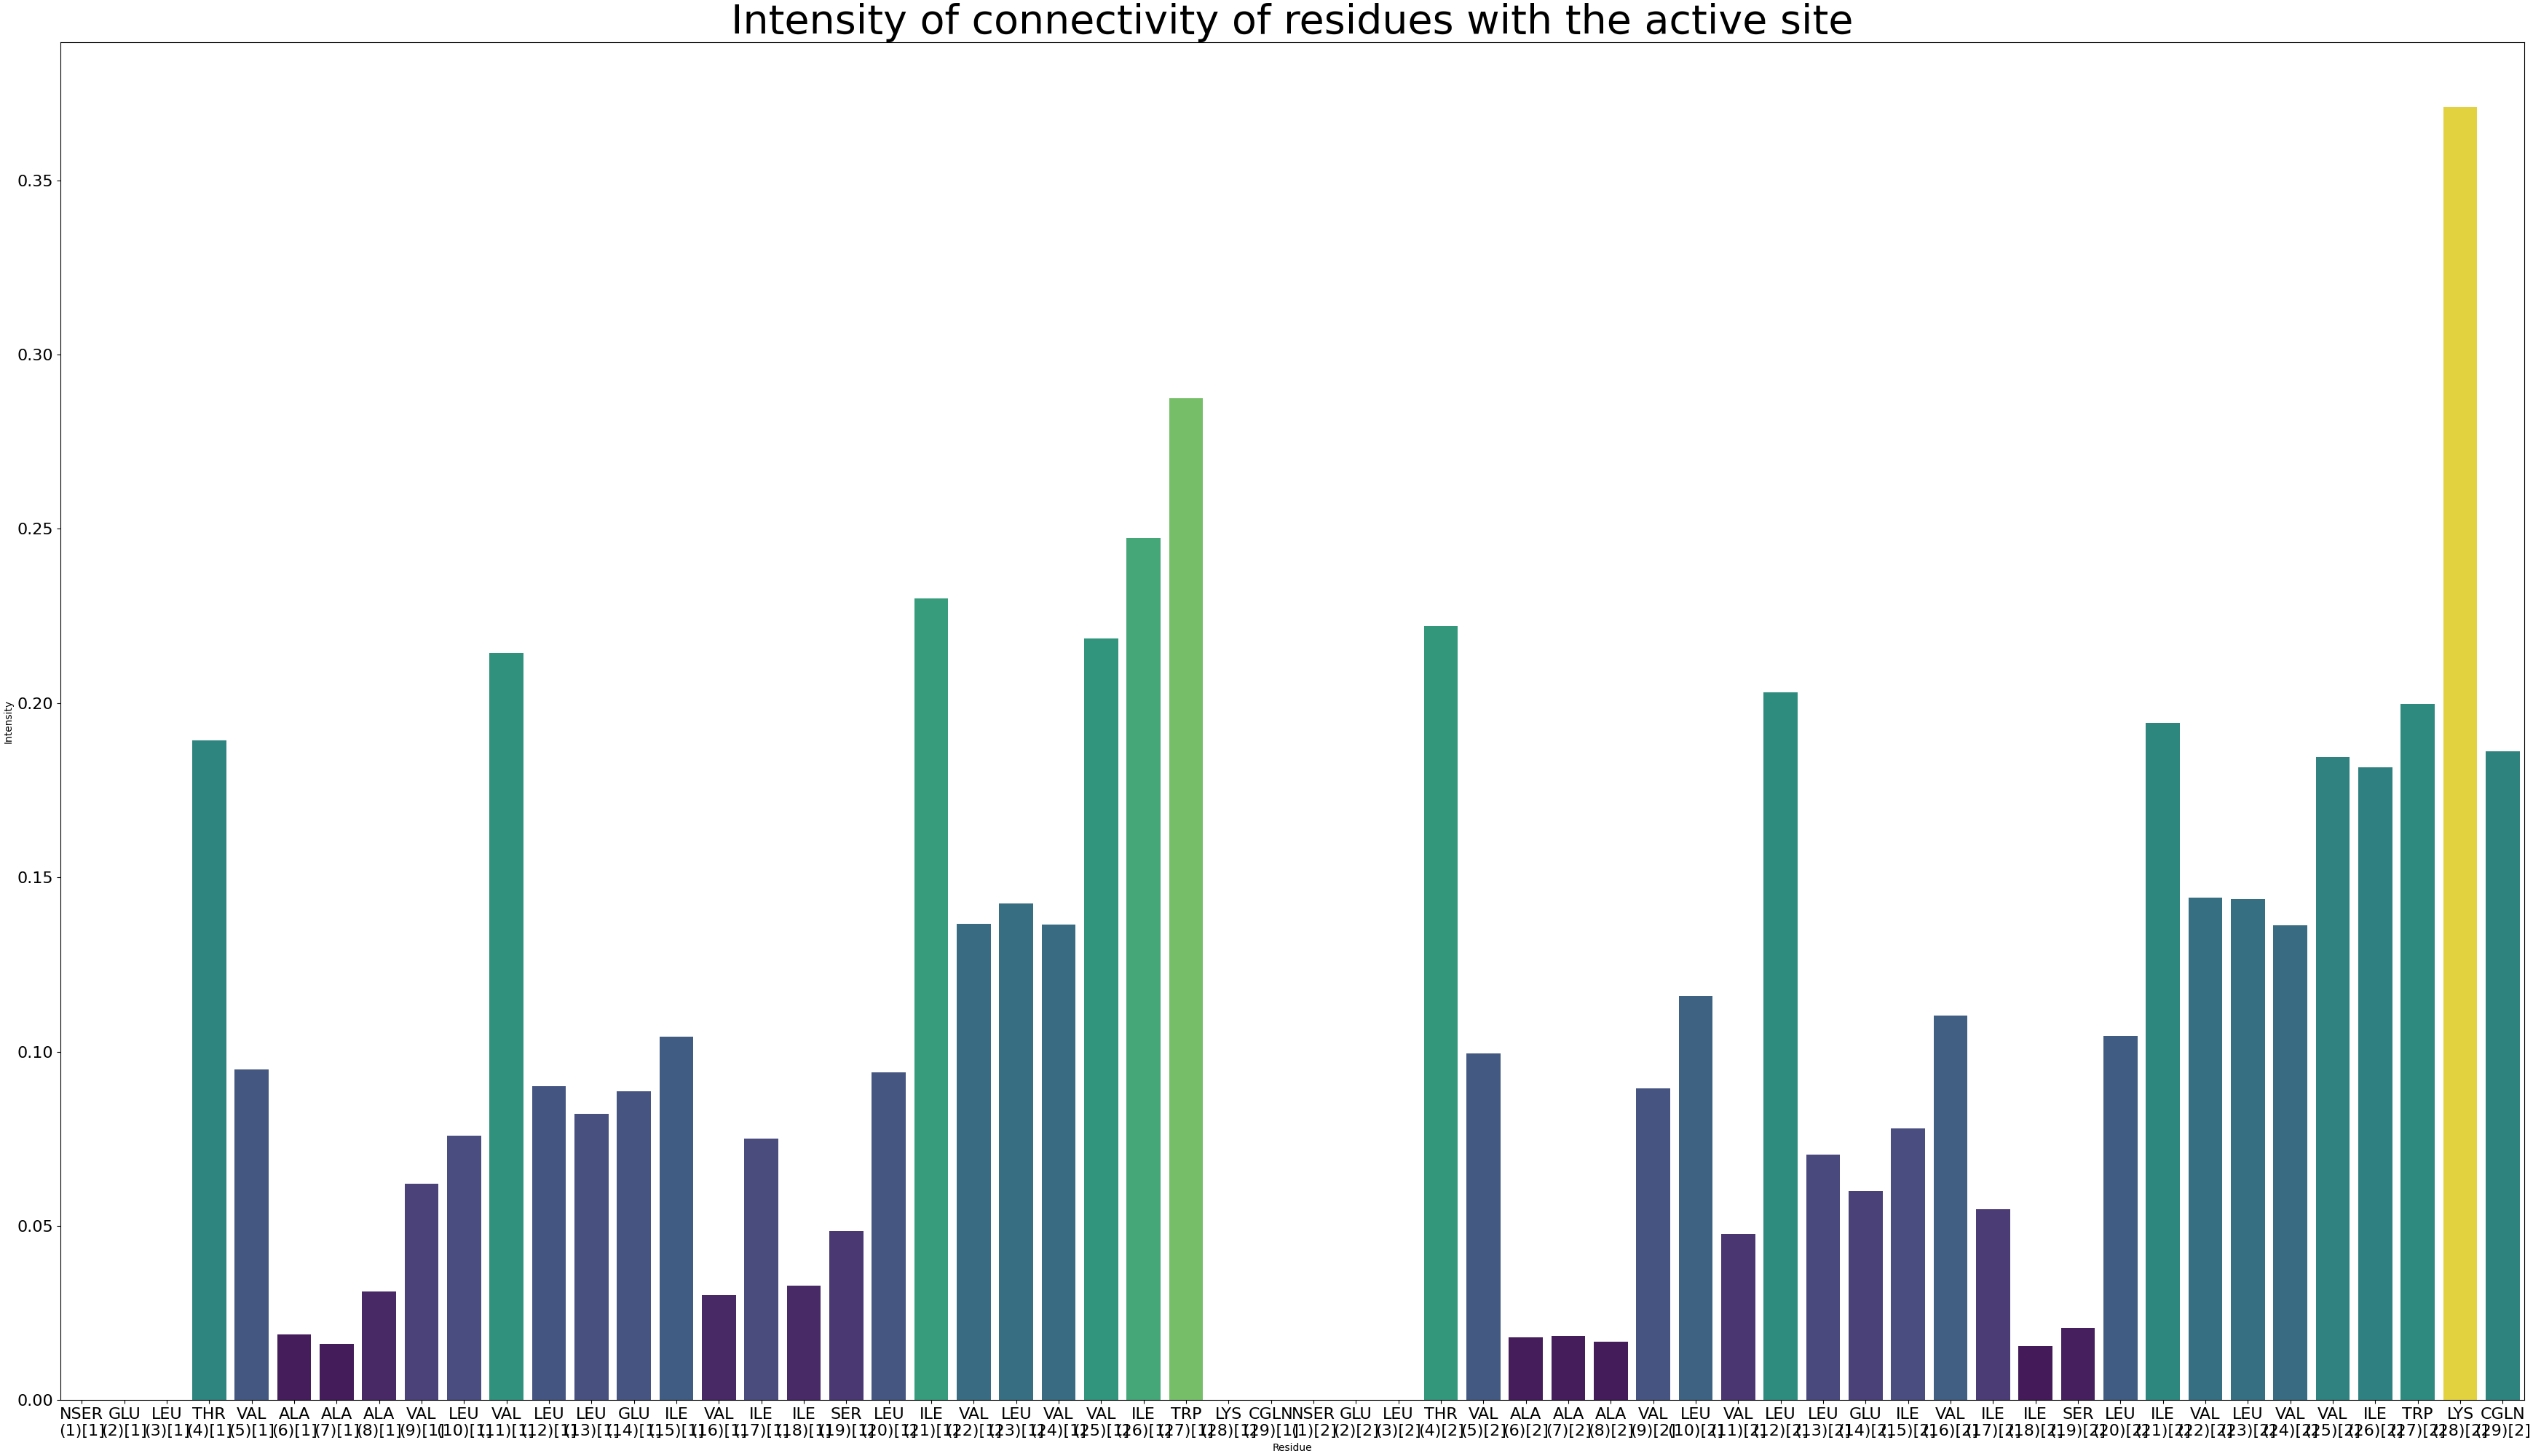
Calculate the communication intensity by running:
artemis allostery --search -noseq 2 output/map.json v536e_groups.json -o output/communication/intensity.pdf
The code running above will create an internal intensity format for ARTEMIS and draw the intensity in pdf format:
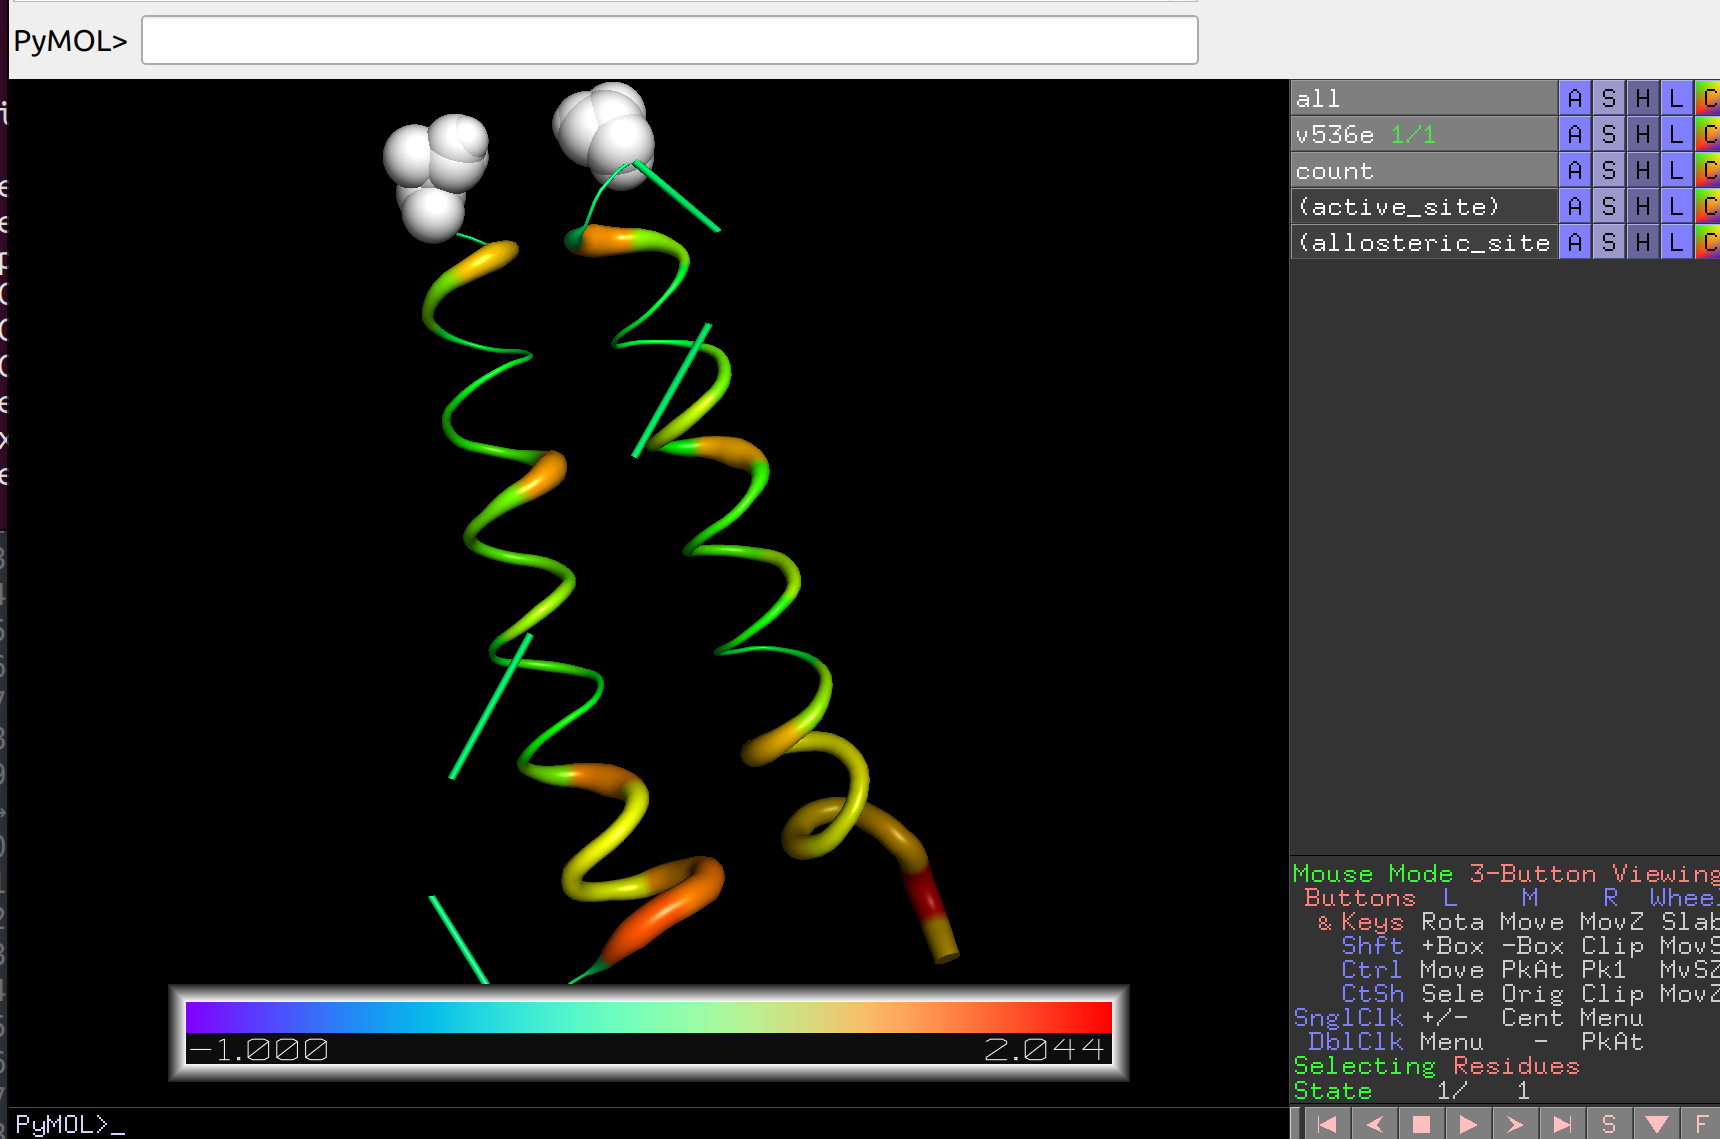
Now let’s draw the intensity of communication on the structure:
artemis allostery --draw -noseq 2 -strc v536e.pdb output/communication/intensity.json -o output/communication/intensity.pse
Which can then be opened in PyMol and analyzed in more detail:
Finally, let’s analyze the intensity of communication within the system and between the specified sites by running (will create text files):
artemis allostery --analysis -noseq 2 -zscore output/communication/intensity.json -o output/communication/intensity.pdf
Good luck in mastering our program! ARTEMIS will continue to develop and new tools will be published in the near future! The manual will also be developed.